
Drive efficiencies and improve patient outcomes with innovative, customized data and technology solutions from our in-house software development team.
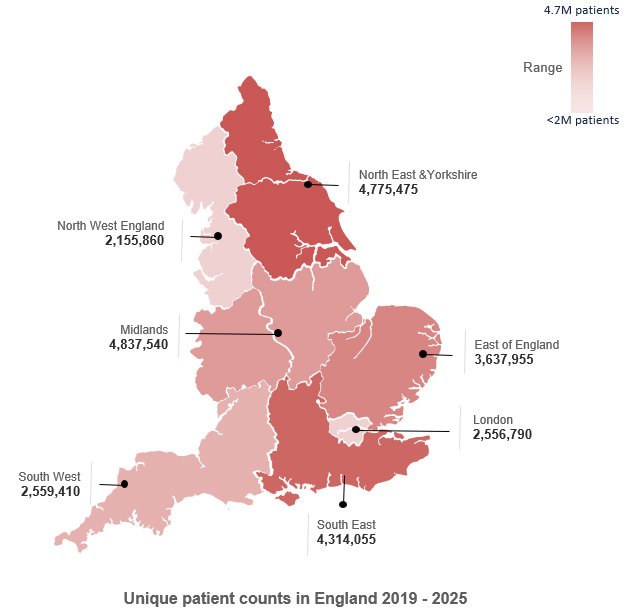
years of Hospital Episode Statistics (HES) data
unique patients
patient interactions
localities, including integrated care systems (ICS)
International Statistical Classification of Diseases and Related Health Problems 10th Revision (ICD-10) diagnoses with 4th character granularity
Office of Population Censuses and Surveys (OPCS) procedures with 4th character granularity
Primary Care Activity Data
Interrogate patient activity in the primary care setting with an anonymized, local-level data set that enables the safe and secure exploration of diagnosis, treatment, demographics and more across England.
Vantage is the first real-world data (RWD) SaaS platform offering the Primary Care Activity Data Panel dataset, including data from all three primary care clinical systems in one consistent format: EMIS, SytmOne and Vision.
Data points include:
- Patient demographics
- Symptoms and diagnoses
- Treatment and prescriptions
- Tests and measurements
- Referrals
This is the fastest-growing GP-provided source of Primary Care Activity Data, with 15.6 million patients added since 2019. Coded using a single code taxonomy, it includes curated code lists for many common primary care conditions.
coded symptoms & diagnoses
total patients
GP practices
coded drugs & treatments
patients with asthma
patients with heart failure
patients with diabetes
Mental Health Data
Explore real-world mental health activity in England with access to rich, patient-level data covering assessment, referral, treatment and care pathways. By using mental health data in the Vantage Real-World Data Analyzer, users can better understand demand, variation and outcomes across services, helping to:
- identify unmet need
- support evidence generation
- inform more effective planning
for patient populations where timely insight is increasingly important. We offer both the NHS Mental Health Services Data Set (MHSDS) and a powerful Natural Language Processing (NLP)-based dataset to provide additional insights, including therapies and signs & symptoms, from patient records.

patients
(MHSDS)
patients
(NPL data set)
years data
(NPL data set)
Claims Data – US
Analyze longitudinal US claims data to understand patient journeys across medical, pharmacy and mortality-linked activity.
With access to large-scale data across payer types, users can evaluate treatment patterns, health care utilization, disease burden and outcomes over time, supporting stronger real-world evidence generation, market understanding and strategic decision-making in US populations.

patient journeys
payers
years longitudinal data
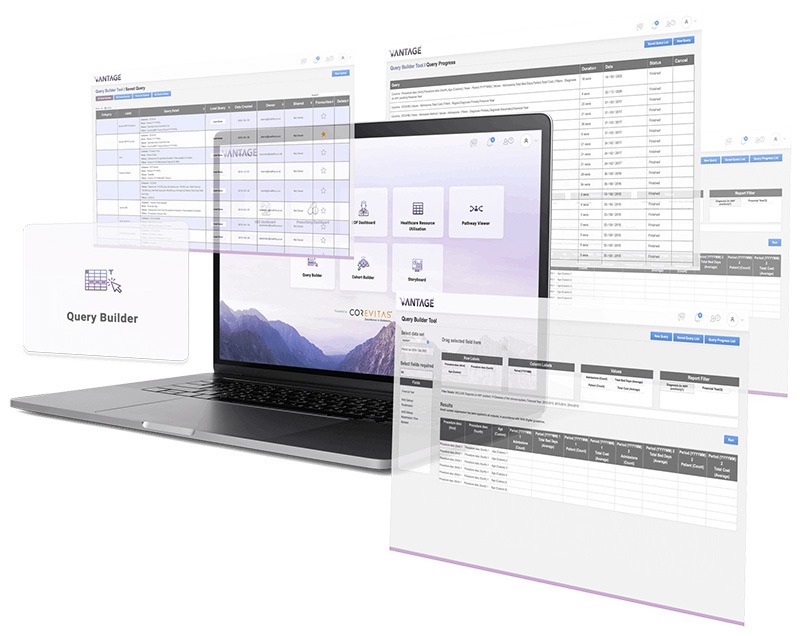
Query Builder
This powerful, intuitive pivot-table solution has the flexibility to query 250+ fields across frequently updated U.K. National Health Service (NHS) datasets, using cross-sectional analysis to evaluate metrics on volumes, trends and patient outcomes. Easily interrogate HES, quality and outcomes framework (QoF) and prescribing data to identify trends and clinical insight to support improved patient outcomes. Drag and drop fields to build, export and share custom tables and export curated reports.
- HES for England and devolved nations
- Primary care activity data
- Secondary care medicines
- U.K. primary care prescribing
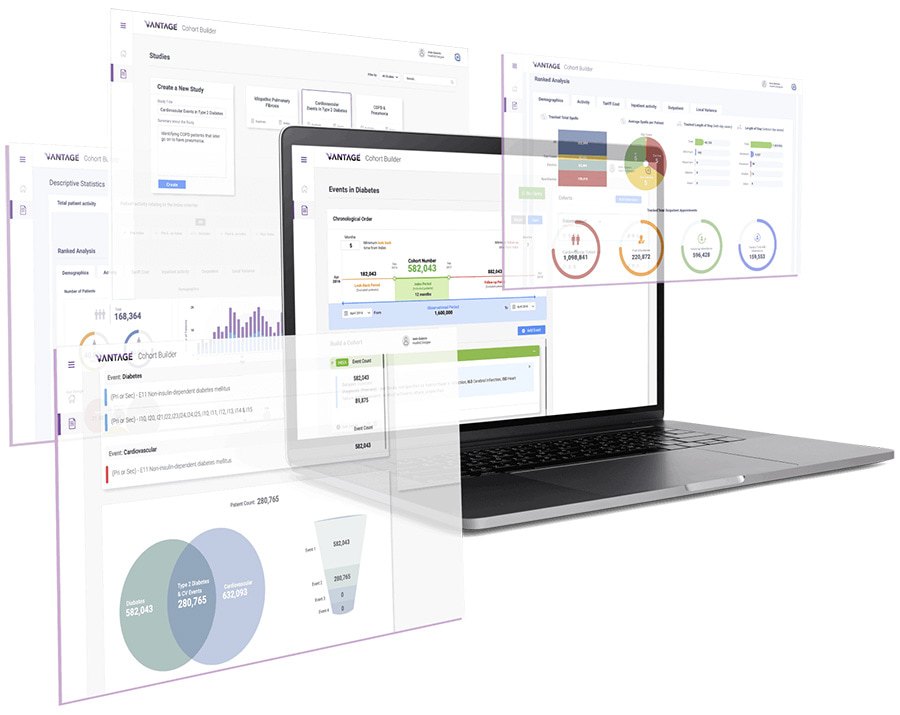
Cohort Builder
Features include advanced, unlimited inclusion and exclusion criteria across six years of primary care activity and HES inpatient and outpatient data, updated monthly, to track patient activity before and after a notable event.
- Pre-populated data points include demographics, activity, costs, simple tracking analysis and more, all easily exported and shared.
- Cohort Analyzer creates fast, effective detailed analysis of your patient cohorts’ activity; export for further data interrogation.
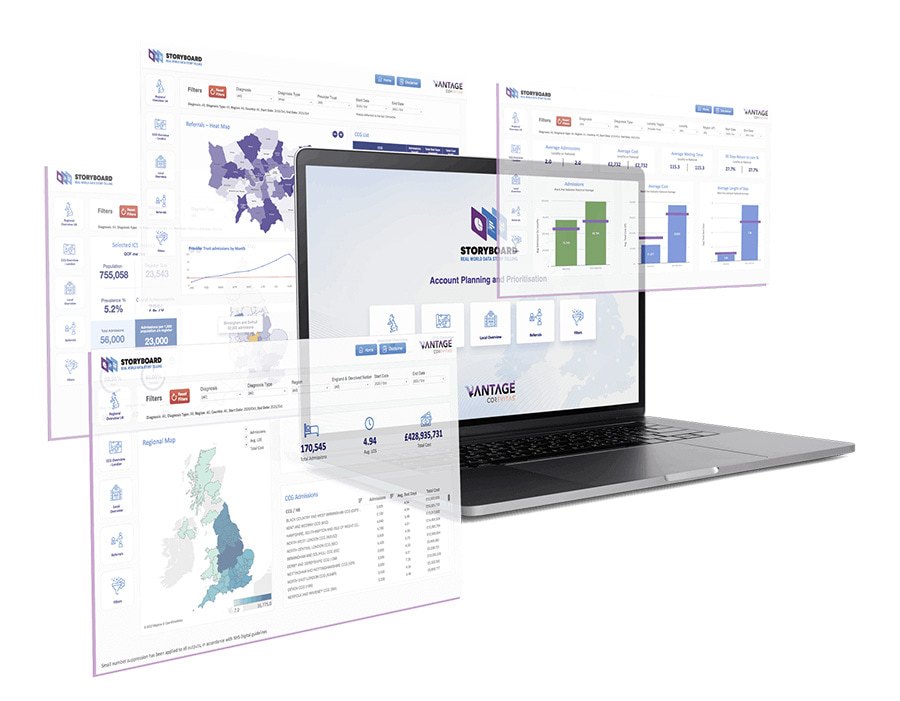
Storyboard
Bring your value story to life. This powerful, interactive real-world data visualization solution is fully customizable and driven by your needs. Incorporating Vantage data sets and/or your own data, our in-house team of designers, clinicians, health care analysts and software developers co-create configurable interactive dashboards for immediate, actionable insights supporting strategic decision making or HCP engagement.
- Available data include: U.K. HES and prescribing, UK primary care activity data, and therapy-specific datasets such as retina or oncology, covering the U.S. and other markets.
- Interactive dashboards with stats, charts, graphs and heat maps to enable users at all levels to quickly interrogate complex data. Take custom designed and branded content offline for further analysis or to share.
chart types
interactions (filters, toggles, etc.)
export options
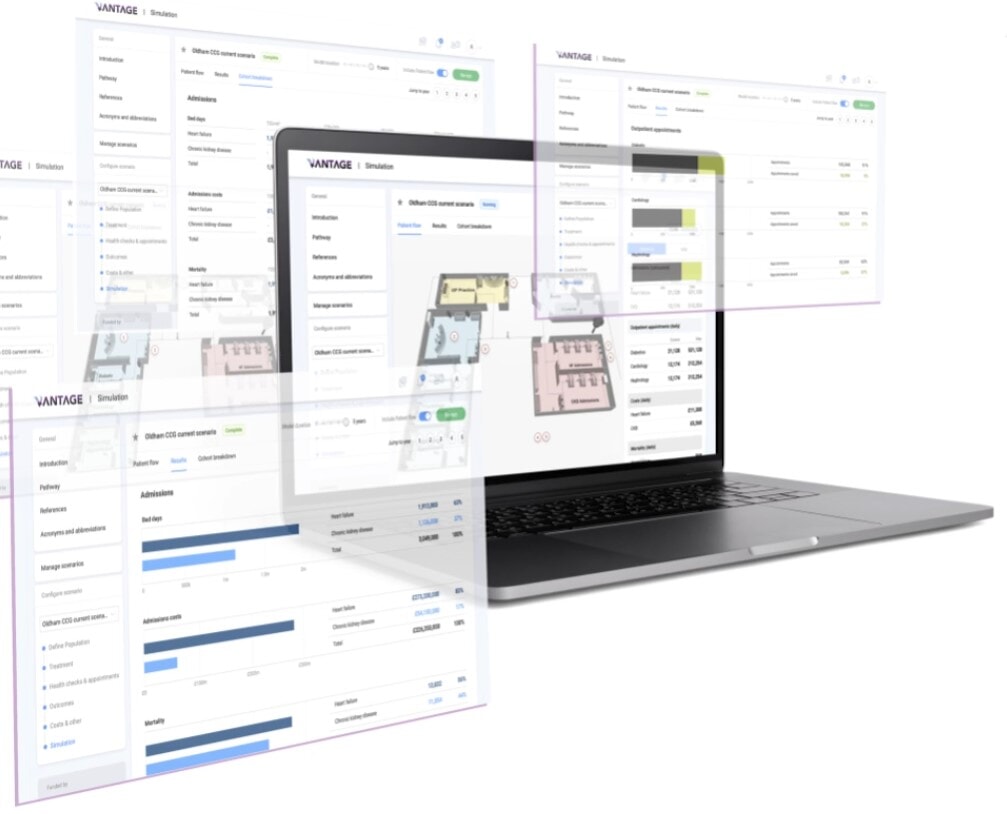
Simulations
Show the impact of a new intervention or service change with custom-built, online and iPad-friendly 3D-animated models to simulate health care pathways. Simulations map and visualize complex real-world patient pathways to initiate change or service transformation with health care professionals and providers. Our interactive, dynamic health care models update in real time, based on your specified inputs from unlimited input fields.
- Pathway mapping: Our in-house experts (clinicians, epidemiologists and data scientists) have more than 10 years of experience building simulations and access to KOLs and payers.
- Share outputs: Share key outputs with health care payers, providers or professionals post-meeting, including a pre-made business case or visual dashboard. Track adoption with monthly usage reporting.
- Medical approval: Support medical approval efforts with specification documents and screenshot packs managed via third party tools.
Additional offerings
Data Insight Packs
Rapid Data Insight Packs provide a cost and time effective option to obtain valuable insights into a given therapy or disease area. Using US closed claims datasets, derived from health insurers (payers), they provide insights into patients’ healthcare activities during a specific enrollment period. Rapid Data Insight Packs are also available for our other real-world datasets, including US ophthalmology data linked to US claims data.
7 metrics tailored for your therapy area
Forecasting
Transform historical real-world data into forward-looking intelligence with visual forecasts built into Storyboard or custom reports. Users can apply forecasting to key metrics such as admissions, appointments, diagnoses or treatment activity to anticipate future trends, helping teams plan interventions, estimate demand and understand where resources may be needed most.
HES Reports
One-off custom reports on outcome metrics in specific disease areas.
Health Inequalities Dashboard
Identify trends and variations in Integrated Care systems (ICSs) and other NHS localities including ethnicity, gender, age and IMD Deprivation scores.
Prescribing Dashboard
Compare product performance across a range of metrics and geographic levels to understand market share or product versus market growth.
Storyboard – Benchmarking & Statistics
Compare populations and localities with greater confidence using benchmarking and statistical visualizations designed to account for variation between patient groups. By incorporating techniques such as Directly Age Standardized Rates (DASR), confidence intervals and clear visual outputs, we help users move beyond simple comparisons to identify meaningful differences, highlight variation and support more robust evidence-based decision making.
Reports based on English public healthcare data for public and professional use.